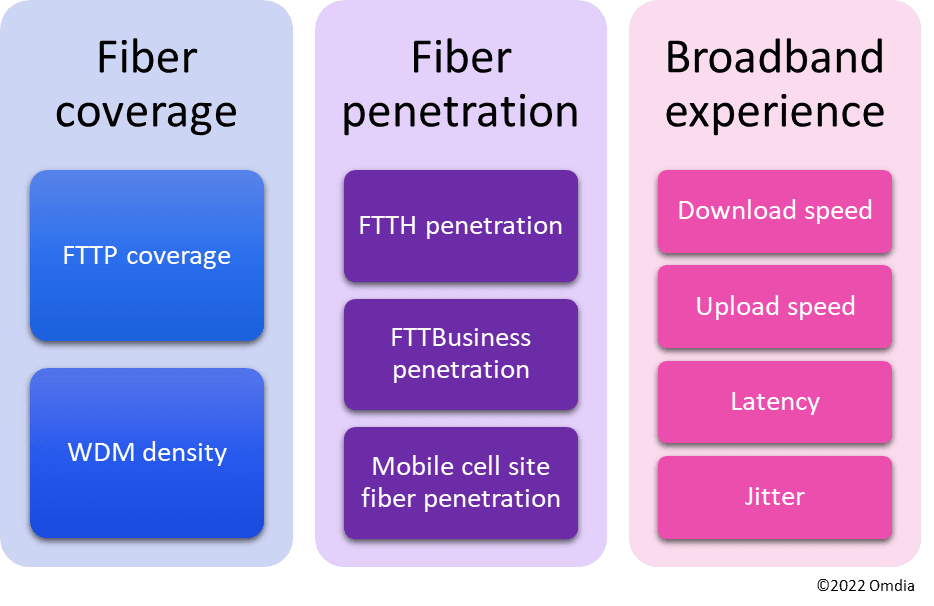
Due to the importance of fiber investment and its impact on global development, Omdia has created a fiber benchmark known as the Fiber Development Index. Unlike other benchmarks that only track a single development metric such as coverage or household penetration, the Fiber Development Index aims to capture all elements of fiber network investment: overall fiber access coverage, fiber to the home (FTTH) penetration, fiber to the business (FTTBusiness) penetration, mobile fiber backhaul, and advanced fiber WDM core technology.
Additionally, the index then aims to measure the outcome of this investment in terms of the country’s overall broadband experience, measured in terms of median download and upload speeds, as well as median network latency and jitter (see Figure 8).
The Fiber Development Index has been further developed in 2022 to enhance three of the existing metrics and add two new experience-related metrics on latency and jitter.
Figure 8 : The Fiber Development Index
– Speed metrics are based on end-user measurement data. – The change to median speed data provides a more realistic view of the speed the average user receives in each market. Please note this is based on the speed the customer receives on the end device and includes the home Wi-Fi network. – An up-to-date view of the market is provided by using the latest available data.
Please note that historic 2020 and 2021 data for all QoE metrics has also been included, and all previous territory scores and rankings have been updated to reflect these changes.
To quantify the level of investment in each segment, Omdia has used a selection of metrics as outlined and defined in Table 1.
Omdia Consulting
We hope that this analysis will help you make informed and imaginative business decisions. If you have further requirements, Omdia’s consulting team may be able to help your company identify future trends and opportunities.
Where to play | What to build | How to win
Learn more about how we help businesses innovate and win. Consult us now.
Table 1 : Individual metrics used in the Fiber Development Index
The total number of residential and business premises covered by the optical-fiber network.
Represents the current potential of the fiber-access network. A limited coverage will mean that only a small selection of households and businesses can gain access to the full benefits of a fiber network.
The total WDM port shipments over 100Gbps over the past five years, divided by the number of households.
Fiber throughout the network supports the necessary quality of experience and reliability that broadband services need. Therefore, a more advanced core fiber network drives greater reliability and performance for broadband networks.
The number of FTTH subscriptions divided by the total number of households.
FTTH household penetration represents the current take-up of FTTH services. The greater the percentage, the higher the number of households that can take advantage of fiber network characteristics.
The number of FTTBusiness subscriptions divided by the total number of business premises.
FTTBusiness penetration represents the current take-up of FTTBusiness services. The greater the take-up, the more businesses will take advantage of FTTBusiness services, enabling a more efficient and more dynamic enterprise.
Mobile cell site fiber penetration
The percentage of total mobile cell sites that are fiber-connected.
Mobile cell sites need high-speed and high-quality backhaul capabilities to optimize mobile-access performance. A high FTTSite penetration will therefore mean a more optimized mobile data network.
The median end-user download speed in Mbps.
Advanced fiber networks can deliver very high-speed broadband services. Although not the only important network metric, speed is essential for delivering bandwidth-hungry applications such as 8K video in a quality fashion.
The median end-user uplink speed in Mbps.
Unlike most other access network technologies, fiber networks can also offer symmetrical services. Although historically deemed more suitable for business, symmetrical services are becoming increasingly important in the residential market.
The median end-user latency in ms.
Latency is the response time between an input and an outcome. This is particularly important in applications such as online gaming but can affect most online activities.
The median end-user jitter in ms.
Low jitter is important for streaming services such as video streaming, online gaming, and video conferencing.
The index aims to combine the individual metrics outlined in Table 1 of this report into a single benchmark measure following a five-step process.
For each metric, various datasets were used to gather as accurate information as possible for each country. Sources include
Where data does not yet exist for a metric in a particular country, estimates were made based on other relevant market information.
The data for each metric was then normalized to offer the same unit of measurement and scale before generating a single overall measure. This is a vital step as many of the datasets can be expressed in different ways—perhaps a percentage or some other metric such as Mbps or km per household. Normalizing the metrics transforms these different measures into a standard scale—in this case, 0–100.
Datasets expressed in a percentage were directly converted into a score out of 100. For other metrics, calculations were based on a reference measure—that is, the ideal goal or using the top country as the reference if the objective is open ended. It is important to note that in such cases, the goals or calculation methods are likely to change as markets develop over time.
In each case, the metric and metric group (see Table 2) are weighted to apply differential levels of importance for the final index calculations. For the FDI 2022, the weighting has been set as per Table 2 to reflect the current importance of continued fiber rollout investment.
In the FDI 2022:
Omdia's Fiber Development Index is an annual research within its Digital Consumer Service. From these subscription research services, you can unlock in-depth analysis and unique strategies across areas such as broadband, messaging and communications, digital operators, smart home, and consumer AI. Learn more here.
If you would like to find out more about how our data and analysis, both subscription and single report/data purchases, help achieve your business objectives, contact us today.
Table 2 : Metric weightings, FDI 2022
Group
Group weighting
Metric
Metric weighting within group
Coverage
33%
FTTP coverage
60%
Penetration
FTTH penetration
35%
FTTBusiness penetration
Experience
Downlink speed
40%
The final index measure was calculated as follows: the group score was created by summing the metrics in that group, multiplying these totals by their weightings, and then summing the group scores multiplied by their weightings.
Finally, sensitivity analysis was carried out to investigate the robustness of the overall index result. To this end, different methods were used to calculate the individual metric scores and the global measure to estimate the general impact on the index results. Such an approach is essential, as data sources can vary from country to country and can often change as their processes are reviewed or local definitions change.
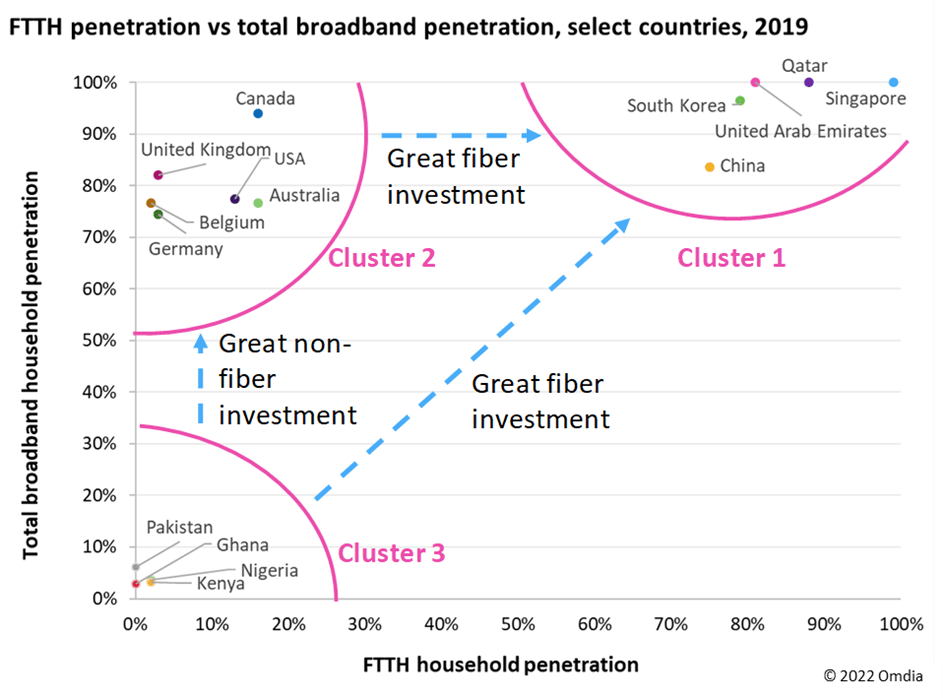
The Fiber Development Index covers 88 territories of varying sizes, demographic and geographical profiles, and levels of broadband development. Due to these widely differing characteristics, it makes it difficult to directly compare them; in Omdia’s opinion, comparison would only lead to unfair and unhelpful conclusions and recommendations. Therefore, to compare individual results, the Fiber Development Index splits territories into three different country clusters:
Figure 9 : Fiber development clusters enable more focused recommendations
In terms of future development, countries or territories in Cluster 2 can only move from left to right (see Figure 9) over time as they continue to replace legacy technologies with fiber-based ones. However, Cluster 3 countries can move up by investing in alternative technologies first (fixed wireless technologies, for example) and then move toward greater fiber access over time, or more in a diagonal direction where fiber investment goes hand in hand with broadband development.
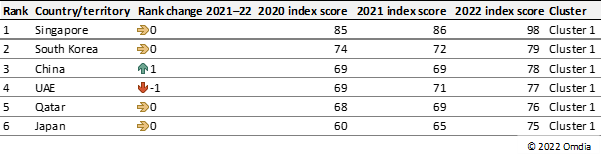
Singapore continues to lead Omdia’s Fiber Development Index, and if anything, it has stretched its lead over all other territories in Cluster 1, with maximum scores in seven out of the nine metric categories. Within the entire index, Chile is the biggest mover in the rankings, increasing an impressive 15 places since 2021, and is now the leading Latin American territory. The UAE continues to be the leading Middle Eastern country, in fourth place overall, although it has dropped one place in 2022 to China. Romania is the leading European country, closely followed by Spain, which jumped one place in this index; however, Sweden (the previous European leader) has dropped five places to 12th overall. The US continues to be the leading North American territory, in 25th place, with South Africa the leading African nation in 64th place (see Figure 10).
Singapore continues to not only remain in the Fiber Development Index’s top spot but to extend its lead as the territory continues its path toward a gigabit society. China has also continued to expand its fiber capabilities, overtaking the UAE to move into third position and closing in fast on South Korea in second place. The remaining Cluster 1 territories have seen no further movement in this update (see Figure 11).
Figure 11 : Cluster 1 scores and changes in the Fiber Development Index ranking
Within Cluster 2, there is significant movement in the rankings as territories continue to evolve to fiber-based broadband networks. New Zealand, which has seen a significant expansion in fiber coverage in recent years due to its Ultra-fast Broadband Program, has entered the top 10 for the first time as FTTH and FTTBusiness penetration continue to increase, in turn leading to growth in broadband quality metrics such as download and upload speeds.
Figure 10 : Fiber Development Index 2022 ranking
However, the biggest mover is Chile, rising 15 places to 13th position. Driven by a mix of public funds as part of the country’s National Fiber Optic project and private investment, Chile has seen a rapid increase in FTTP coverage (from 29% back in 2020 to 64% in 2022), which in turn has led to FTTH penetration more than doubling and also, therefore, a significant improvement in overall broadband experience. Other countries that have seen big improvements in their ranking include the US, Canada, the Netherlands, and Ecuador.
It is also worth noting some of the territories in this Cluster that had taken an early leading position in previous rankings, such as Sweden, Portugal, and Norway, but are now starting to slip down the index (see Figure 12). This is often due to an early investment in FTTP coverage, followed by a slower move to advanced broadband technologies and FTTP penetration. This then leads to a stall in the overall broadband experience improvement compared to other territories. This shows how vital it is that after an initial investment in fiber access infrastructure, territories continue to invest in the core of the network and push customer penetration if they are to evolve to gigabit societies.
Cluster 3 is made up of emerging broadband markets where FTTP coverage is typically less than 10%. Indonesia and Paraguay are two exceptions: both have relatively high FTTP coverage of 46% and 27%, respectively. However, both territories have still to turn that coverage into a high level of fiber penetration—something they should both now focus on.
Many of the other territories in this cluster, such as Nigeria, for example, are only now starting to see early shoots of FTTP investment. Others, such as Uganda and Morocco, have already seen some increase in FTTP penetration, which has led to increased scores around broadband experience, but FTTP coverage still remains very low (see Figure 13). All these territories must continue to look for ways to increase fiber coverage as they try and move toward fiber-first broadband nations.
Figure 12 : Cluster 2 scores and changes in the Fiber Development Index ranking
Rank change 2021 - 2022
Figure 13 : Cluster 3 scores and changes in the Fiber Development Index ranking